IOportal Summer Update
Our latest IOportal release brings several improvements above and under the hood, as well as a multitude of useful new features:
New “Ports and Ldev Groups” graphics
Identifying which frontend ports are mapped to which servers and preparing the respective graphics can be a cumbersome and time-consuming task. The new feature in the Performance menu, available as “Ports and Ldev Groups” under the Storage Resources menu, provides an easy and intuitive solution to this problem. The user is presented with those port tuples that are currently mapped by server clusters. By choosing one such tuple, the user obtains performance graphics of all involved ports as well as of all server clusters that have mapped the selected port tuple, along with a top10 server graphic. This time-saving feature makes root-cause analysis even faster and easier!
New automatic time resolution in performance graphics
So far, users could choose the desired time resolution for performance graphics, amongst 1 min, 5 min and 1 hour. For practical reasons, the IOportal retains data with low resolution for shorter periods of time. Data is retained indefinitely for 1 hour resolution. Hence, it could happen that the user chose a time resolution in combination with a time range where data is not available. Furthermore, when creating time series graphics over long periods of time, e.g. several weeks or months, it is important to switch to the largest available resolution. In our latest release, all this is handled automatically in the best possible manner. The user can leave the resolution switch to “auto” and he will always get time series graphics in the best available resolution, without minding the details.
Compare any two graphics side-by-side
During a root-cause-analysis it is common to look for time correlation amongst different resources and metrics. Looking for specific time ranges across different graphics is tedious and error-prone. However, the user can now choose any two graphics and view them next to each other. Furthermore, the crosshair lines when hovering over a plot are synchronised across both graphics, making it easier than ever to compare different plots.
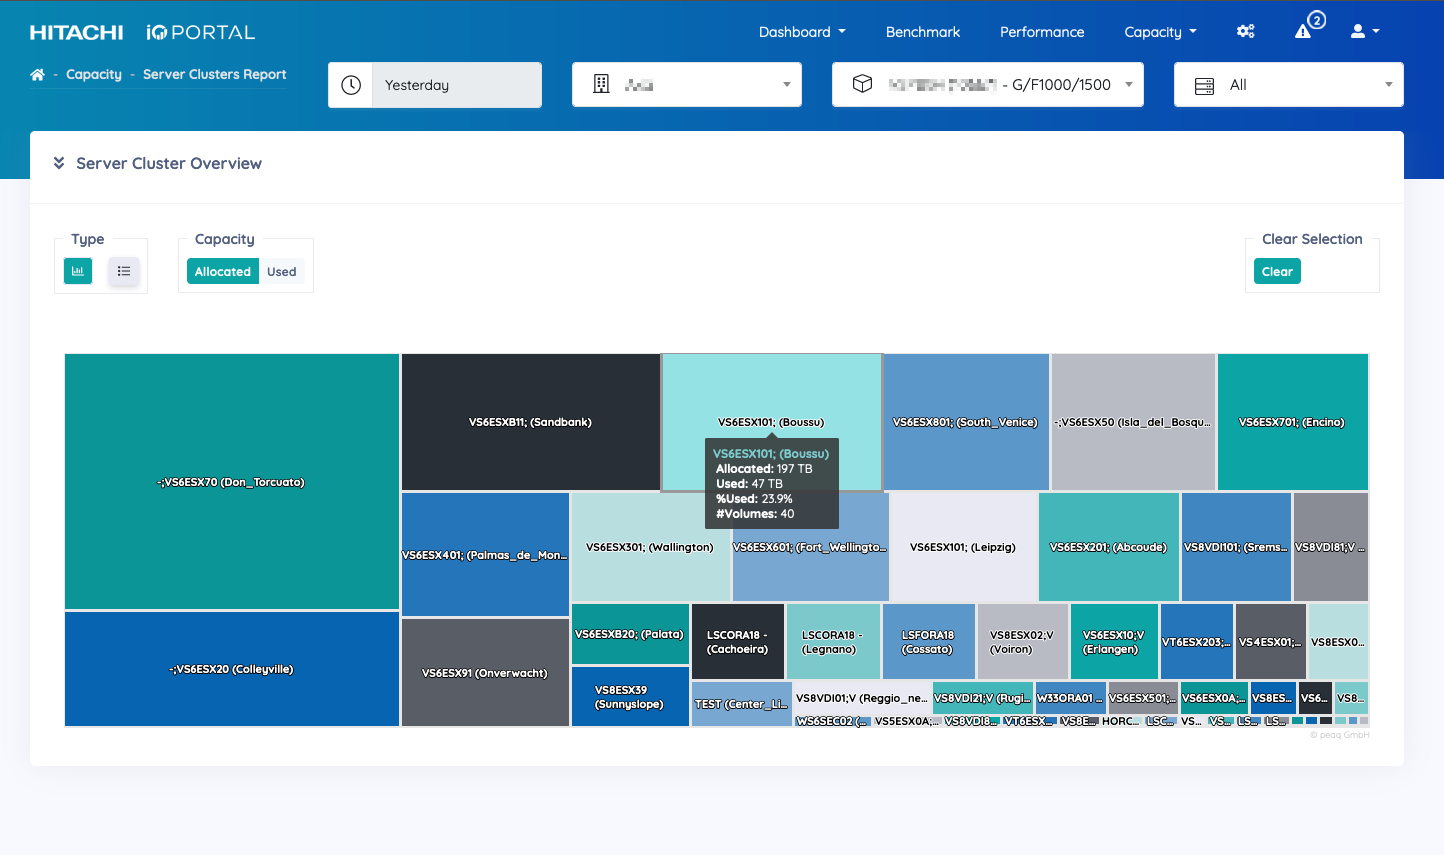
New Server Clusters Tree Map View
The Server Clusters report now includes a new tree map graphic that provides an overview of all server clusters of the array, scaled according to their relative allocated or used capacity. A tabular representation, that can be downloaded in spread sheet format, complements the tree map and makes it easy to see all server cluster at a glance. Furthermore, the tree map acts as a navigation element and makes it easy to select a server cluster and see its details below the tree map graphic.
New Port Load Imbalance Alerts
The throughput of ports pairs (e.g. CL1-A and CL2-A) is expected to be more or less identical under nominal conditions, where multipathing software splits the traffic equally between ports. Imbalanced ports are a common reason for performance issues or inefficiencies and require investigation. The new “Port Load Imbalance Alert” automatically monitors the throughput of all port pairs during the previous day and alerts the user when significant load imbalances are detected.
New Pool Thresholds Alerts
Pool alerts have been part of the IOportal for several years. The threshold values were fixed and corresponded to Hitachi best practices, i.e. warning above 70% and risk above 85%. However, since each pool is utilised differently by our customers, we now use the custom threshold values that are defined on a per-pool basis by the customer himself in their management software. These custom thresholds are made available to the IOportal along with the capacity data (HORCM) and are henceforth used for driving the pool alerts, i.e. customers are only alerted when a pool crosses the threshold that they themselves have defined. We are confident that the new solution will prove more useful and less intrusive.


