New major IOportal Release V8
Only 2 months after announcing SAM4H V2 today we are pleased to announce IOportal V8, the state-of-the-art capacity and performance workbench for Hitachi’s block storage systems. From a total reimplementation of the engine - only perceivable by the user as a substantial gain in graphic generation speed - to the new and revolutionary Anomaly Detection System, almost no part of the IOportal remained untouched.
While preserving all the strong features of the IOportal the users are familiar with and love for their intuitive use and unparalleled insight into Hitachi storage arrays dynamical behavior we added several new views and dashboards guiding the user from her/his logon to the IOportal to any anomaly detected by our smart, AI based Anomaly Radar revealing the root cause of performance degradations and resource constraints/bottlenecks within a few clicks.
Whether you work from a laptop or workstation or any mobile device (tablet and/or mobile phone) the new appearance of the IOportal V8 adapts itself to your device and allows you to navigate and enjoy the graphs and reports with the same ease of use and the same level of presentation quality.
IOportal v8.0 Release Notes
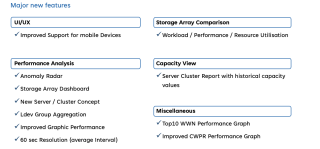
UI/UX
Improved Support for mobile Devices: Improve navigation and graph presentation for improved user experience.
Performance Analysis
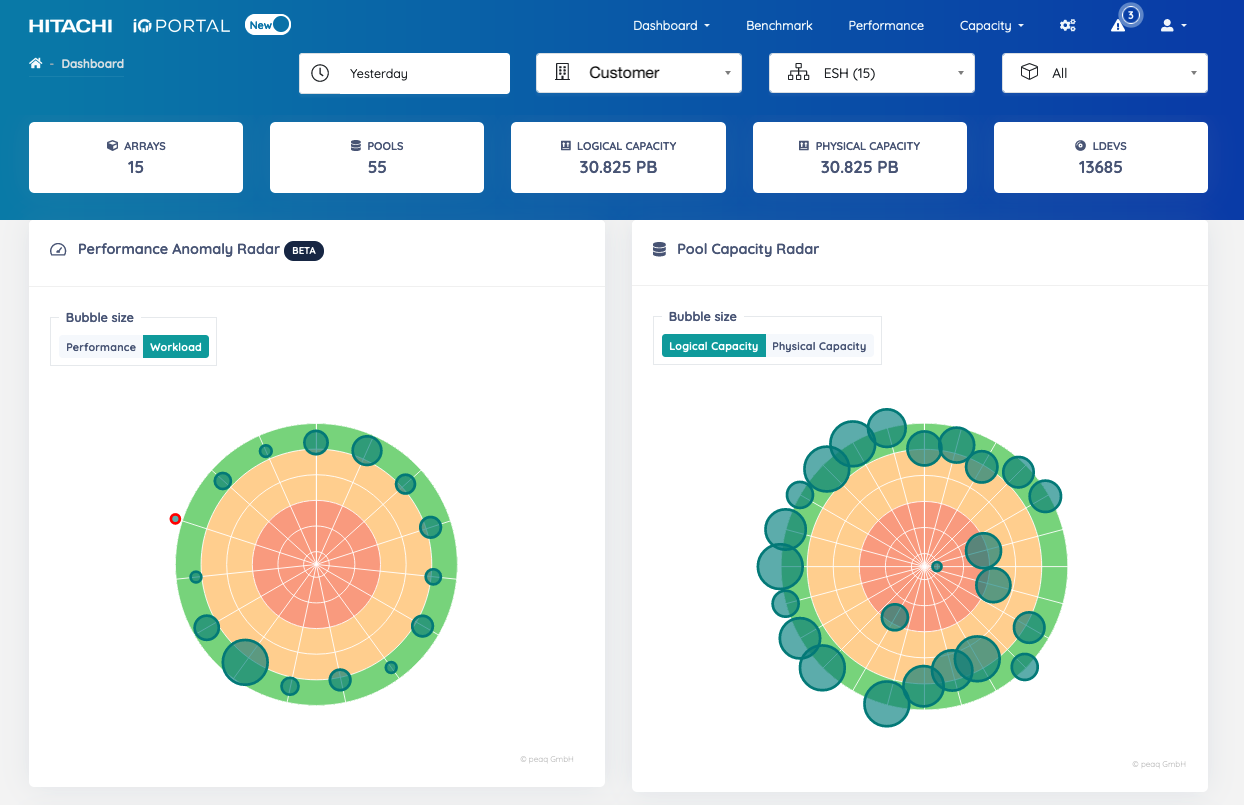
- Anomaly Radar: Leverage an AI based anomaly detection algorithm to highlight abnormal storage system behavior and guide the user automatically to the next step in the root cause identification process.
- Storage Array Dashboard: Provide KPI values for a user selectable date and the past 90 days. Also provide additional valuable information to accelerate root cause analysis.
- Server/Cluster Concept: The new concept allows to unambiguously distinguish between different servers/clusters and takes varying Lun configuration (over time) into account when creating performance graphs.
- Ldev Group Aggregation: Based on the new Server / Cluster concept the Ldev (Logical Device) data aggregation was completely redesigned to be more flexible. It handles servers / clusters, pools and Mainframe Control Units.
- Improved Graphic Performance: Depending on the time resolution (average interval) and the length of the time range the performance of the graph creation process was improved by a factor 2 – 5.
- 60 sec time resolution: 60 sec time resolution (average interval) was added for all performance graphs for the past 14 days data and a time range less than or equal to 24 hours. For longer time ranges the IOportal automatically switches to longer resolution.
Storage Array Comparison
- Workload / Performance / Resource Utilisation: Provide direct comparison of customer’s storage arrays for workload, performance and resource utilisation based daily aggregated data for a user selectable date.
Capacity View
- Historical Values for Ldevs and Ldev Groups:
- Server / Cluster Report:
Miscellaneous
- Top10 WWN Performance Graph: Reduce number of WWN graphs by grouping IOPS, TPUT and Response time into a standard Top10 chart adding Worktime.
- Improved CWPR Performance Graph: Reduce number of CWPR graphs by incorporating all Cache blades into a single graph.
The IOportal has continuously been improved over the past 10 years since its inception and has kept setting new levels of storage system capacity and performance analysis that helped customers leverage their Hitachi storage systems to achieve the highest possible business value.


